
Database
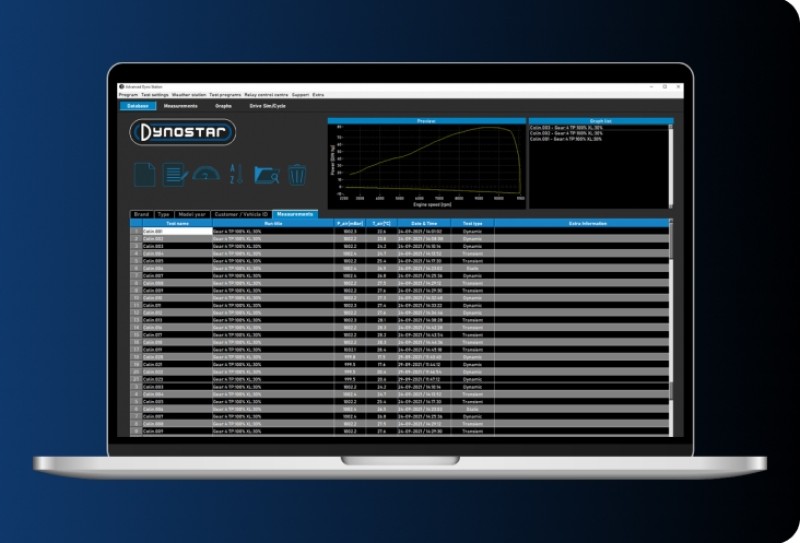
In this screen you will build a database with the history of all your measurements. The database consists of 5 folders and is designed in such a way that runs are stored in a ordered manner. Upon request it’s even possible to change the name of each folder. The standard folders in the database are; Brand, Type, Model year, Customer/vehicle ID and Measurements.
Measurements
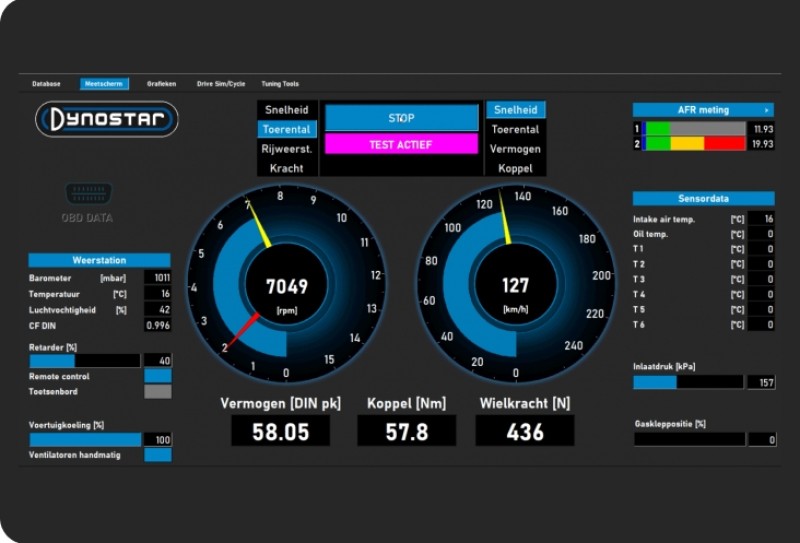
The Measurements screen, is the main testing screen. In this screen all live data is displayed and tests are performed. The screen is centered around two large gauges. These gauges can show the engine RPM, vehicle speed, power, torque, road load and wheel force.
The left gauge has a double function and is also used for retarder control. While the yellow dial represents the vehicle, the red dial represents the current position of the dyno. By using the knob on the Dynostar remote control or the scroll wheel on the keyboard, the brake can be controlled.
Graphics
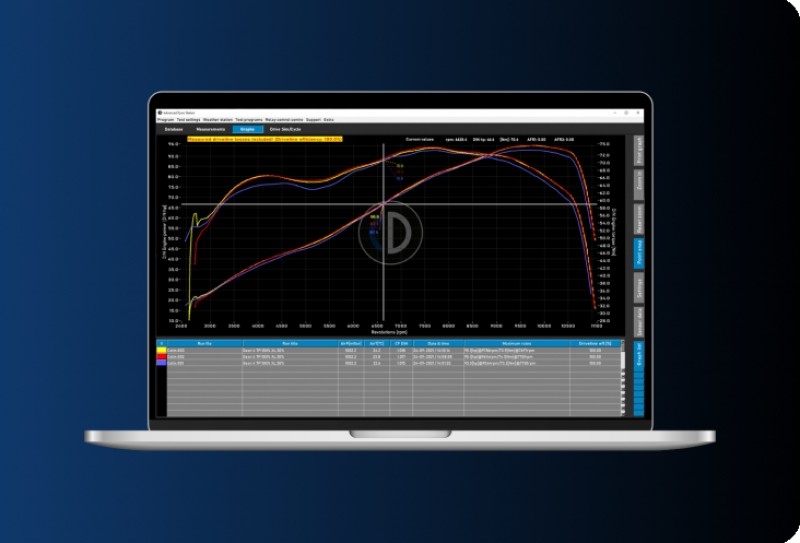
The graphics screen is used to view and evaluate test data. It can be used to view wheel power, engine power and driveline losses. All measurements stored in the database can be loaded into the graph so they can be compared. Besides te power figures of the vehicle sensor data can also be displayed in a graph.
Various other graphs are also available to determine acceleration, slip and even a dedicated graph for electric vehicles.
System requirements
- Intel i5 processor (comparable) or better
- 8GB RAM / internal memory
- Windows 10 operating system recommended (minimum Windows 7)
- Minimum 500MB available for installation (excluding database)
- Video card 250MB or higher
- RS232 serial port or USB port with USB/RS232 converter
- Minimum screen resolution 1920x1080
Customize to your requirements
Various languages, measurement systems and correction factors can be selected in the Advanced Dyno Station software. This allows users from around the world to customize the software to their preferences.